As a developer, experimenting with different tools and technologies is one of the most rewarding parts of the job. Recently, I built a Cashbook Application that combines Next.js, Firebase, and a charting library to create a comprehensive and dynamic solution for managing cash flow data.
This project was not just an exercise in building a functional app but also part of my training to master Next.js as I prepare to work more efficiently with Sitecore XM Cloud, which heavily relies on modern JavaScript frameworks like React and Next.js. Here's a breakdown of my journey, key features, and lessons learned.
The full source code for this project is available on GitHub.
What is the Cashbook App?
The Cashbook App is a simple financial tracking application designed to help users:
- Log income and expenses with details like date, amount, and description.
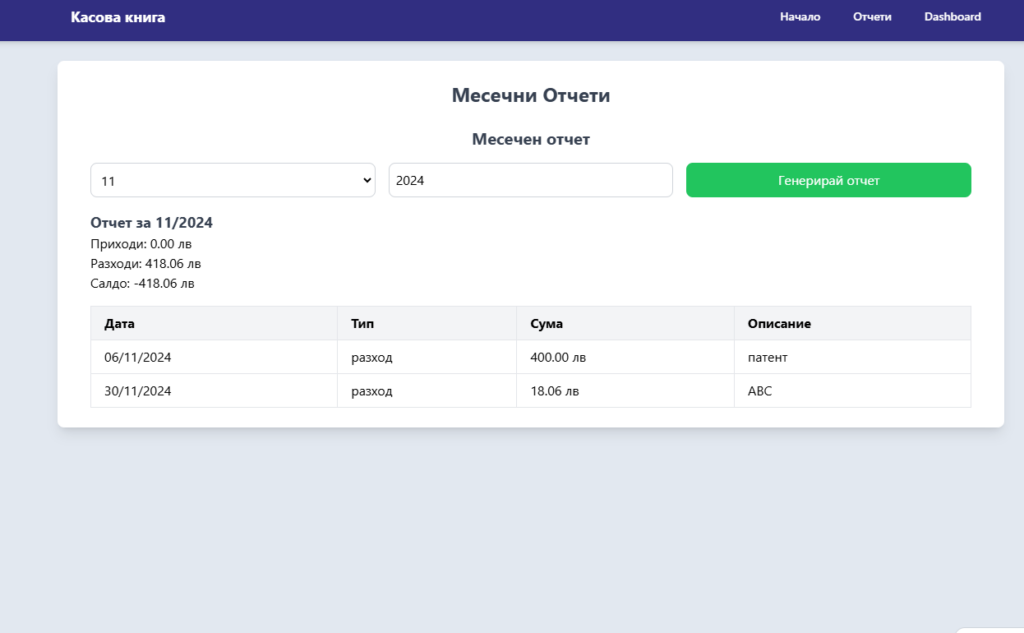
- View monthly reports summarizing their financial activity.
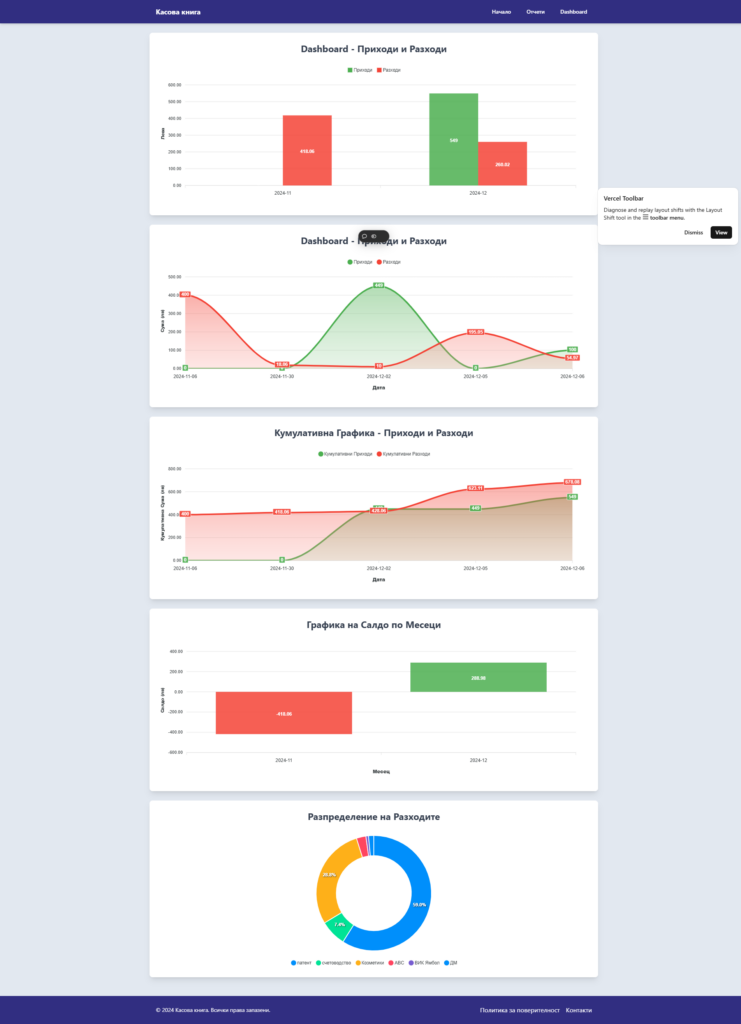
- Visualize trends with charts, such as cumulative totals and monthly comparisons.
Why Next.js?
Next.js is a powerful React framework that makes it easy to build fast, SEO-friendly, and scalable web applications. For the Cashbook App, it provided:
- Built-in Routing: Seamless routing for pages like "Dashboard", "Reports", and "Login".
- API Routes: Used to integrate Firebase for storing and retrieving data.
- SSR and CSR Options: Allowed dynamic charts to load only on the client, resolving server-side rendering issues with libraries like ApexCharts.
Why Firebase?
For a cashbook application, a robust and easy-to-use database is essential. Firebase Realtime Database was an excellent choice because of:
- Ease of Use: Straightforward setup for CRUD operations.
- Real-time Sync: Instant updates across devices.
- Free Tier: Perfect for small-scale applications like this.
Challenges with Firebase
- Read-Only Deployment on Vercel: Since Vercel uses a read-only filesystem, I had to rely on Firebase entirely for data storage and updates.
- Handling Firebase Keys Securely: Environment variables were managed using Vercel's settings to ensure security.
Data Visualization with ApexCharts
One of the app's highlights is its ability to visualize financial data. After testing several libraries, I chose ApexCharts for its:
- Customizability: Easy to tweak chart options.
- Elegant Design: Charts look professional with minimal setup.
- SSR Compatibility: While dynamic imports resolved most issues, ApexCharts worked smoothly in a client-side rendered setup.
Key Features of the Cashbook App
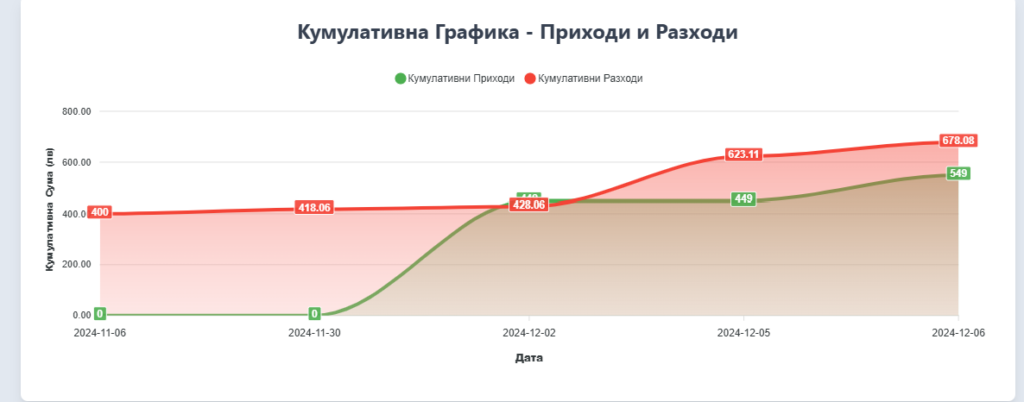
1. Cumulative Chart
Tracks cumulative income and expense over time, helping users visualize their financial trajectory.
2. Area Chart
Compares income and expenses over time, providing insights into spending patterns.
3. Monthly Bar Chart
Displays total income and expenses for the last 12 months.
Here’s a snippet for generating a Cumulative Chart with ApexCharts:
setChartData([
  {
    name: "Cumulative Income",
    data: cumulativeIncome,
  },
  {
    name: "Cumulative Expense",
    data: cumulativeExpense,
  },
]);

setChartOptions({
  chart: { type: "area" },
  xaxis: { categories: sortedDates },
  yaxis: { title: { text: "Amount (лв)" } },
  tooltip: { x: { format: "dd MMM yyyy" } },
});

Enhancing User Experience
Using Tailwind CSS, I styled the app to maintain a clean and responsive design. Here are some examples:
- Navbar and Footer The app includes a consistent navbar for navigation and a sticky footer with a professional appearance.
export default function Navbar() {
  return (
    <nav className="bg-indigo-900 text-white p-4">
      <div className="max-w-6xl mx-auto flex justify-between">
        <Link href="/">Home</Link>
        <Link href="/reports">Reports</Link>
        <Link href="/dashboard">Dashboard</Link>
      </div>
    </nav>
  );
}
Interactive Tables The Cashbook entries are displayed in a sortable, paginated table. Entries are color-coded (e.g., green for income and red for expenses).

Lessons Learned
While building this project, I faced several challenges:
- Chart Libraries and Deployment: Recharts and Chart.js had SSR-related deployment issues on Vercel. ApexCharts, with dynamic imports, proved to be a more robust solution.
- Data Aggregation: Aggregating data from Firebase for charts required meticulous grouping and calculation logic.
- Secure API Keys: Storing sensitive Firebase credentials in
.env.localand configuring them securely in Vercel was crucial.
Final Thoughts
The Cashbook App was a rewarding project that strengthened my skills in:
- React Frameworks: Leveraging Next.js features effectively.
- Database Integration: Handling real-time data with Firebase.
- Data Visualization: Designing meaningful charts for actionable insights.
The app is fully open-source and available on GitHub. I hope this inspires you to build your own data-centric applications with these tools.


